 by
by 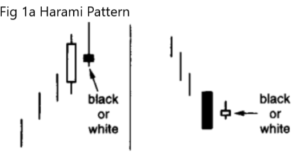
#1 Harami Pattern
- A small real body that is contained within what the Japanese call “an unusually long black or white real body”. The shadow of the second day can be above or below the prior’s day high and low. [Fig 1a]
- Second candle of harami can be white or black
- Reverse of the engulfing pattern
- Not necessary for the two bodies to be of opposite color. However, in most cases real bodies of harami are oppositely colored
- Smaller the second real body, the more potent the pattern
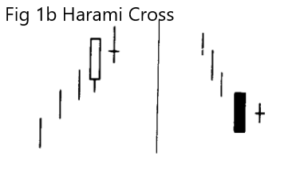
Harami Cross
- A doji preceded by a long black real body during a decline (or a tall white body during a rally) [Fig 1b]
- More potent reversal signal than the regular harami pattern
- Harami cross can also call bottoms, but they seem more effective at tops
#2 Tweezers Tops and Bottoms
- Two or more candle lines with matching highs or lows
- In a rising market, a tweezers top is formed when two or more consecutive highs match
- In a falling market a tweezers bottom is formed when two or more successive lows are the same
- Tweezers can be composed of real bodies, shadows, and/or doji
- Ideally have a long first candle and a small real body at the next session
- Must have either the first candle long, second candle short or a candle pattern (eg Piercing Pattern) with the same highs/lows
- Can be used on weekly or monthly charts without other candle confirmation
- Can look at volume for confirmation. Eg Overbought with Tweezer Top and vice versa
Tweezers Top
- Comes after an ascent
- A top reversal pattern where the two successive highs are the same
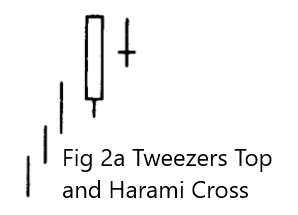
1. Tweezers Top and Harami Cross
A long white line followed by a doji. Aka Harami Cross with the same high
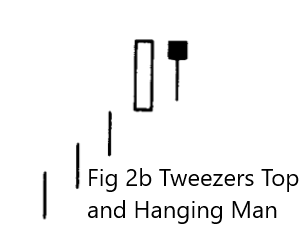
2. Tweezers Top and Hanging Man
A long white candle followed by a hanging man. Can also be considered a Harami
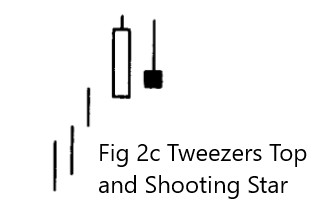
3. Tweezers Top and Shooting Star
A long white candle followed by a shooting star line
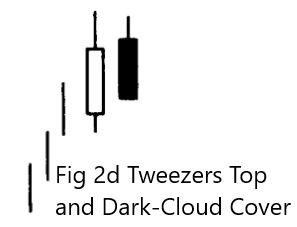
4. Tweezers Top and Dark-Cloud Cover
A variation of the dark-cloud cover (2nd day opens above prior’s day close rather than prior day’s high).
Tweezers Bottom
- Comes after a descent
- A bottom reversal pattern where the two successive lows are the same
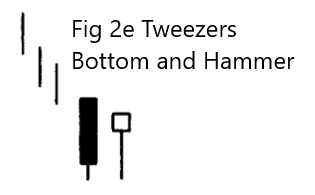
1. tweezers Bottom and Hammer
A black candle followed by a hammer. Aka a harami. The lows of it can also be viewed as a support
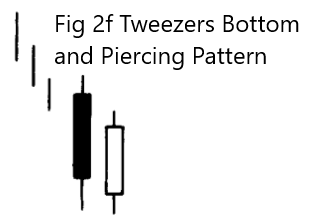
2. Tweezers Bottom and Piercing Pattern
Variation of the bullish piercing line (Opened under the prior day’s close rather than low)
#3 Belt-Hold Lines
- Individual candle line
- Longer the Belt-Hold line, the more significant it becomes
- More important if they:
- Confirm Support/Resistance
- Confirm other Belt-Hold Lines
- Have not appeared for awhile
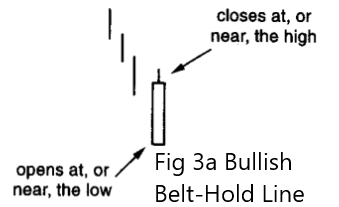
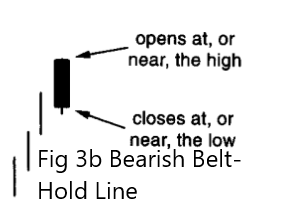
- The open must be close to the low (for bullish) or the high (for bearish)
- Bullish Belt-Hold: Strong white candle that opens on the low of the session (or with a very small shadow) and closes at, or near, the session highs. Also called a white opening shaven head.
- Bearish Belt-Hold: Long black candle that opens on the high of the session (or close to the high) and closes at, or near the low of the session. Also called a black opening shaven head.
Trading the Belt-Hold Lines
Possible entry at the close above the high of the pattern. For a long candle in the Belt-Hold line, stop loss can be set at the middle of the candle. It is important to note that Belt-Hold lines should be used in conjunction with other technical indicators/patterns.
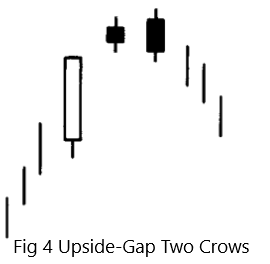
#4 Upside-Gap Two Crows
A three-candle pattern with the follow characteristics:
- Candle 1: A bullish candle that continues the uptrend, represented by a long white/green candle where the closing price is way above the opening price
- Candle 2: A black candle which gaps up from the previous candle on open
- Candle 3: Second black candle where the opening is above the first black real body’s open, and closes under the first black candle’s close. But it closes above the first candle’s close. Can be seen as a bearish candle that “engulfs” candle 2
- Candle 4 (Confirmation): Candle gaps down from the third candle, highlighting that the bears have taken control
You can read more about it here.
#5 Counterattack Lines
- Opposite colored candles have the same close
- Second candle’s color reflects the reversal trend
- Flexibility in the same close levels (can be marginally different)
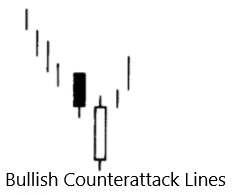
- Bullish Counterattack Line
- Pattern occurs during a decline
- First candle of the pattern is usually a long black candle. Next session opens sharply lower, but the bulls push prices back up to unchanged from prior close
- Second candle should open sharply lower
- Less significant than the piercing pattern. This is because unlike the piercing pattern it does not pierce into the prior’s session real body, only to the close
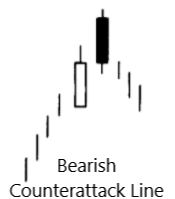
- Bearish Counterattack Lines
- Pattern occurs during a rally
- First candle of the pattern is a long white candle. In the next session the opening gaps higher, but the bears push the prices back down to prior day’s close
- Second session should open robustly higher
- Less significant than the dark-cloud pattern (dark-cloud cover sends a stronger top reversal signal). Explanation same as the bullish counterattack line
All image credits goes towards the book “Japanese Candlestick Charting Techniques” by Steve Nison. Nison, S. (1991). Japanese candlesticks charting techniques: A contemporary guide to the ancient investment techniques of the Far East. New York Institute of finance.