 by
by 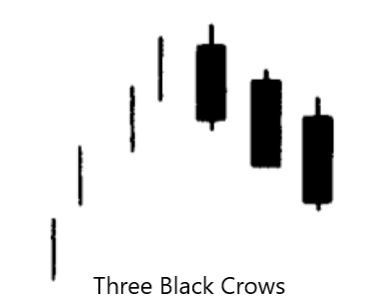
#1a Three Black Crows
- Bearish pattern with three declining consecutive black candles
- The three should close at, or near their lows
- Ideally each openings should be within the prior session’s real body, or below the prior days close and failed to gain substantial ground
- Useful as a longer term pattern as pattern is only completed by the third black candle
- Predicts the reversal of an uptrend
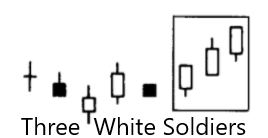
#1b Three Advancing White Soldiers
- Opposite of the Three Black Crows
- Group of three long white candles with consecutively higher closes
- Close at or near its highs
- Ideally each opening should be within or near the prior session’s real body
- Ideally the pattern appears at a low price area or after a period of stable prices
- Useful only for longer-term bullishness as buying at the completion of the pattern may not have an attractive risk/reward
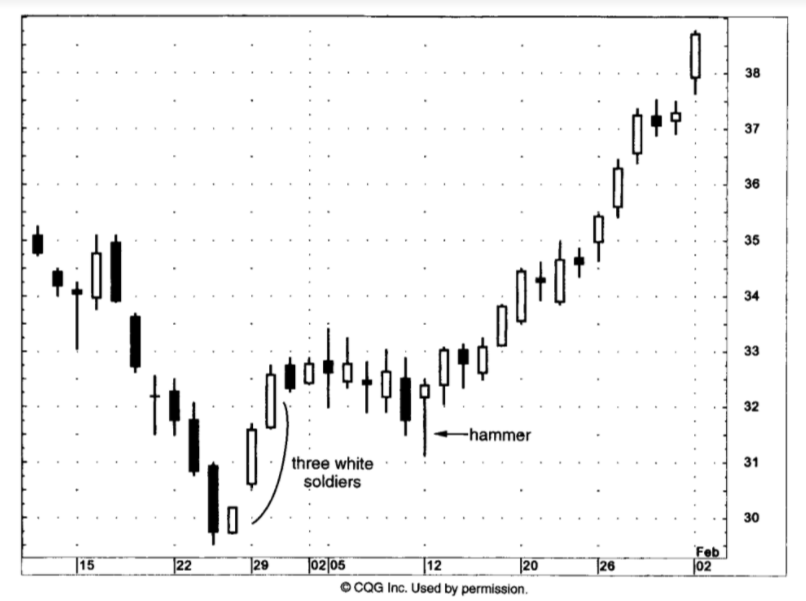
On corrections, first and second candle of the three white soldiers pattern is often the support
Above: Hammer confirmed support within the second candle of the pattern
bii) Stalled Pattern
Two long white candles followed by a small white candle, where the last white candle can either gap away from the long white body or it will be at the upper end of the prior long white body. It suggests that the bulls’ strength has been exhausted.
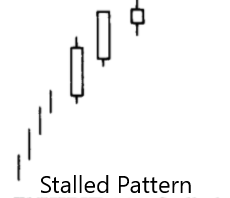
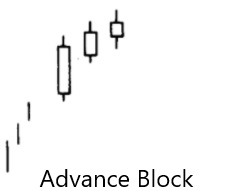
Things to note about the Advanced Block/Stalled Pattern
- Clues that the rally is losing force
- Usually to liquidate/protect longs, usually not to short
- Not a good reversal pattern
- More consequential at higher price levels
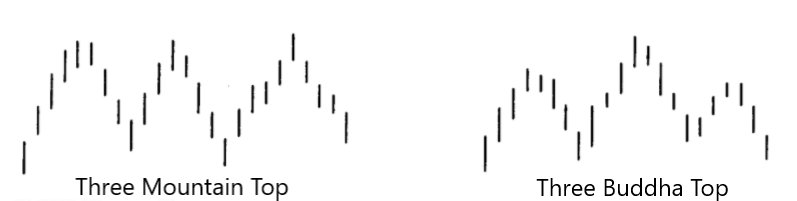
#2a Three Mountains
- Market backs off from a high three times or makes three attempts at a high
- High point of the final mountain ideally should be confirmed with a bearish candle indicator (eg Doji/Dark-Cloud Cover)
- May indicate a reversal of a stock’s upward trend
- Not necessary for the three price peaks to be exactly the same highs
Three Buddha Top
Central mountain of the three mountain top is the highest (see Fig 6.36). Same as the western heads and shoulders pattern.
The neckline of the pattern when broken, becomes the resistance
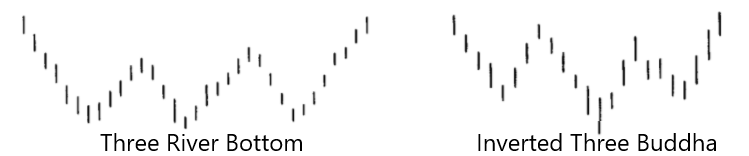
#2b Three River Bottom
- An opposite of the Three Mountain Top
- Occurs when the market tests a bottom three times
- The peak of the troughs should be exceeded to confirm a bottom
Inverted Three Buddha
- Inverse of the heads and shoulders pattern
- Middle price bottom is the lowest
- The neckline when broken, becomes the support
Drawing the neckline
- Locate the left shoulder, head and right shoulder
- Drawing the neckline:
- Heads and Shoulders: Connect the low after the left shoulder and the low after the head
- Inverse Heads and Shoulders: Connect the high after the left shoulder and the high after the head
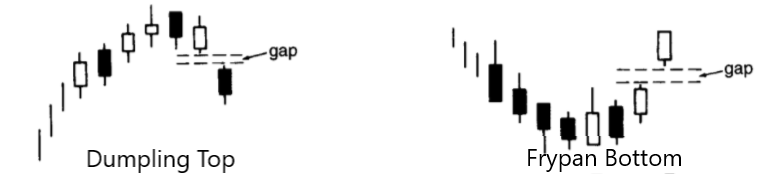
#3a Dumpling Tops
- Top reversal that usually has small real bodies as the market forms a convex pattern
- Market goes from higher highs to same highs then to lower highs
- Confirmation afterwards when the market gaps down
- Gap down becomes the resistance
- Same as the Western Rounded Top, but with the additional confirmation
#3b Frypan Bottoms
- Bottom reversal pattern where it forms a concave design
- Market goes from lower lows to the same lows then higher lows
- Confirmation occurs afterwards when the market gaps up
- Same as the Western Rounded Bottom, but with the gap up confirmation
For both the Dumpling Tops and Frypan bottoms, because of the gap, it is more significant than the classic Western patterns (Rounded Top & Bottom)
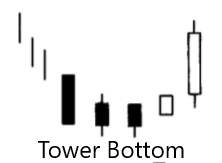
#4b Tower Bottoms
- Occurs in a descending market
- Long black candles followed by smaller candles (to reduce bearish tone) followed by long white candles
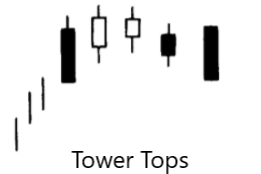
Both Tower Tops/Bottoms are more useful for longer-term traders as it takes a long time for the pattern to complete.
Differences between Tower Tops/Bottoms and Dumpling Top/Frypan Bottom
- Tower Tops/Bottoms needs long black and white candles for the “towers”, not needed for Dumpling Top/Frypan Bottom
- No gap needed for Tower Tops/Bottoms, but is necessary for Dumpling Top/Frypan Bottom
All image credits goes towards the book “Japanese Candlestick Charting Techniques” by Steve Nison. Nison, S. (1991). Japanese candlesticks charting techniques: A contemporary guide to the ancient investment techniques of the Far East. New York Institute of finance.