 by
by What is a Candlestick?
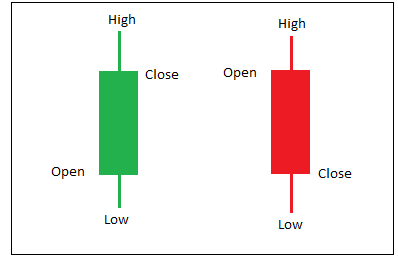
Type of price chart used in TA that displays the high, low, open and closing prices of a security for a specific period.
- Rectangular sections are known as the real body, representing the range between the session’s open and close
- Thin lines above and below are the shadows, representing the session’s price extremes
- Shadow above is the upper shadow
Shadow below is the lower shadow
Characteristics of the Candlestick
- When the real body is black (or red), it means that the close of the position is lower than the open
- When the real body is white (or green), it means that the close was higher than the open
- Peak of the upper shadow is the high of the session
- Bottom of the lower shadow is the low of the session
- If candle has no upper shadow, it is said to have a shaven head
- If the candle has no lower shadow, it is said to have a shaven bottom
Limitations of Candlesticks
- Does not provide price targets, require western technicals or trend analysis to forecast price targets
- Candlesticks and by extension reversal patterns does not signal the extent of the move, only the reversal of a trend
Price Target: Analyst’s prediction of a security’s future price