 by
by Hey everyone! For this week’s article, we will go through what is an Inverted Yield Curve. As many of you know, a yield curve is an essential part of bonds and today we will talk more about what it is, as well as the complications of an inverted yield curve. Let’s begin!
How does a Yield Curve work?
To begin, let us talk about how a yield curve works. A yield curve is bounded by 2 axes, with the y-axis representing the yield and the x-axis representing the maturity (duration). The most common yield curve is the one that reflects the short, medium and long-term rates of US Treasury securities. The yield curve allows investors to easily compare similar treasury investments with different maturity dates. How it works is that the points of each maturity and their respective yield is plotted before connecting to form the yield curve.
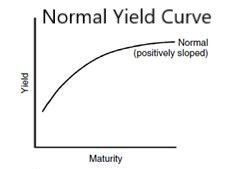
Typically a yield curve is in a positive slope, as longer maturities have a higher yield than shorter maturities. As holders of longer maturity bonds expect more risk, they expect to be rewarded more (with higher yields) for taking on said risk compared to shorter-term bonds.
How does a Yield Curve Invert?
A yield curve inversion occurs when the yield of longer-dated maturities is lower than that of shorter-dated maturities. This results in a negative sloping yield curve as seen in the image below.
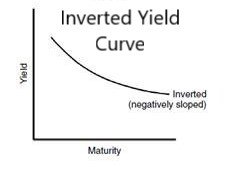
The way this could occur could be due to rising short-term yields, falling long-term yields or a combination of the two. For the yield curve to invert, it will have to flatten first (see below).

Bonds price and yield relationship
Before I cover the reasons why the yield curve inverts, I will preface by talking about the relationship between bond price and yield. The bond price and yield have an inverse relationship due to the following formula:
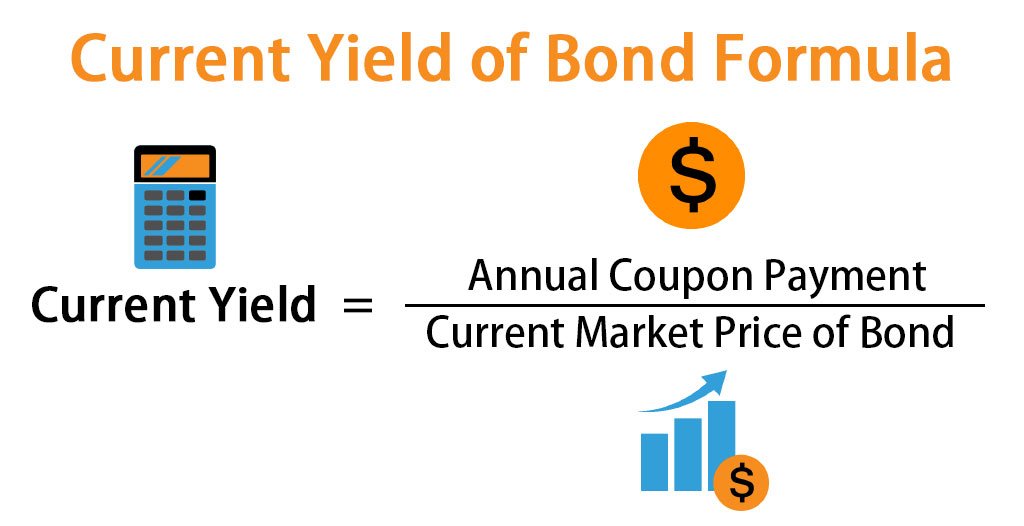
What this means is that if the market price of bonds increases the yield of the bond decreases (and vice versa). The market price of bonds is determined by the demand and supply of said bonds which can be influenced by a multitude of reasons, such as inflation rate, interest rate and more.
Why does the yield curve invert?
Yield curve inversion takes place when longer-maturity yields fall much faster than shorter-maturity yields. This could happen when there is a surge in demand for long-term bonds compared to short-term bonds.
For example, if economic growth is expected to slow, investors might also expect interest rates to fall. This expectation increases the demand for higher-yielding maturities (bonds with longer-dated maturities), causing the price of such bonds to go up. This in turn, drives the yield of longer maturities lower.
Secondly, it could also be due to expectations of long and short term inflation rates. If long-term inflation is expected to fall and short-term inflation is expected to rise, the yields will rise and fall in relation to the expectation of inflation rates. This is because investors will demand a yield that takes into account the inflation risk (think of real vs nominal returns and how investors would demand a reasonable real return).
Lastly, it could be also due to the Fed buying more long-dated bonds or selling more short-dated bonds. Based on the bond price and yield relationship, this can cause the short-term bonds’ yields to rise and long-term bonds’ yields to fall.
Do note that the above are just some examples of why a yield curve could invert. It could be due to a combination of the above and other reasons as well,
What does an Inverted Yield Curve mean?
An inversion of the yield curve suggests that there is a high chance of a recession in the near future. As shown, from January 1955 to February 2018, the inversion of the yield curve has predicted all but one negative, where the ‘false positive’ instance was followed by an economic slowdown rather than a recession (Bauer & Mertens, 2018).
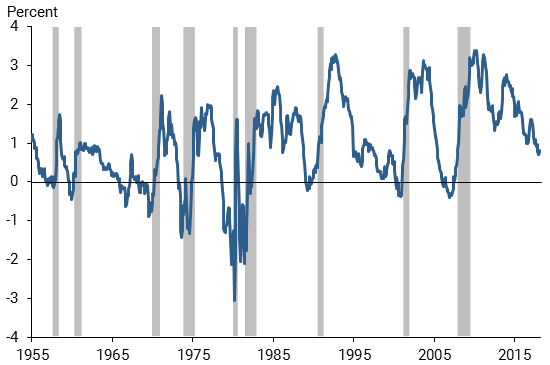
That being said, sometimes yield curve inversions are early and do not predict an immediate recession. In December of 2005, the yield curve inverted, which was approximately two years prior to the Great Recession! We should also take this with a pinch of salt as while there may be some correlation between the two, it is not a proof of causation.
Conclusion
And that’s it! Hopefully, this article will; help you better understand the yield curve inversion and its significance to investors like yourself! I have also attached a video on Yield Curve inversion which I found to be greatly informative so do give it a watch if you’d like.
Thank you all for reading and if you found this useful be sure to like and share this article! Do comment on what other topics you would like me to cover in the future. In the future, I will cover more about how bonds work which will cover the concepts of bond yield and more so stay tuned : ) Cheers!
-Rice

Citations
Bauer, M. D., & Mertens, T. M. (2018, March 5). Economic forecasts with the yield curve. Federal Reserve Bank of San Francisco. Retrieved June 25, 2022, from https://www.frbsf.org/economic-research/publications/economic-letter/2018/march/economic-forecasts-with-yield-curve/