by
by Dark-Cloud Cover
Dual-candle pattern that is a top reversal after an uptrend.
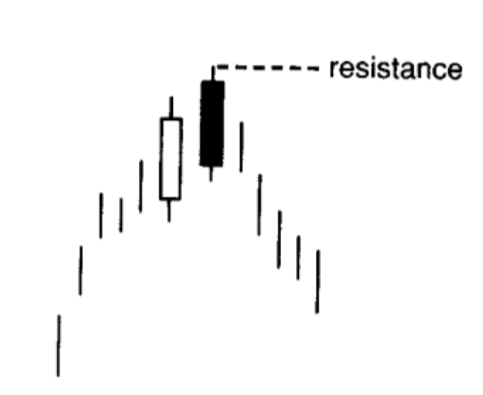
Criteria for a Dark-Cloud is:
- First day is a strong white body
- Second day price opens above the previous day high, but by the end of the second day’s session the market closes deeply within the prior day’s white body
Greater the penetration of the white body, the more likely it is a top
Some require more than 50% penetration
- In some scenarios, it is considered a dark-cloud cover even if the second day open is above the previous closing price but below the high
Rationale behind Dark-Cloud Cover
Bulls are in complete control from the first day large white candle till the second day open. However, the technical picture changes afterwards as the market closes not only beneath the prior close, but well within the prior day’s real body – offsetting the gain of the first session. Many who are waiting to sell short will have a benchmark to place the stop – at the new high of the second day cloud pattern- while the longs will have second thoughts on their position.
More factors to consider (in increasing importance)
- The greater the penetration of the black body’s close into the prior white real body, the greater the chance of a top reversal. Think of how if the black candle fully engulfs the white candle’s body it is a bearish engulfing pattern. Hence the bearish engulfing pattern can be a stronger reversal than a dark-cloud pattern. A strong white candle after a bearish pattern could signify a reversal into another bullish stance i.e. another rally (3 Candles: 2 forming a bearish pattern, followed by one strong white candle).
- If the second body of dark-cloud cover opens above a major resistance level and then fails, it shows that the bulls were unable to take control of the market
- On the second day, very high volume could lead to a buying blowoff (many new buyers jump into buying the stock then the market sells off very quickly).
- The highest high of the two sessions that formed the dark-cloud cover should be a resistance (Additional Point, not in any order of importance)
Piercing Pattern
Dual-candle pattern that is opposite of a dark-cloud cover.
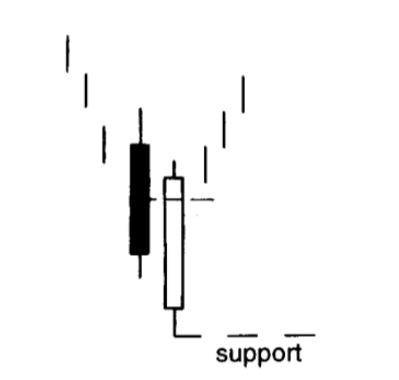
Criteria for Bullish-Piercing Pattern
- First day is a black real body candle, second day is a white real body candle
- Must be on a downtrend
- Second day white candle opens lower, ideally under the low of the prior black day. Prices then rebound and pierce well into the black candle’s real body
- The greater the degree of penetration into the black real body, the more likely it will become a bottom reversal. Ideally should have more than 50% penetration.
Rationale behind a Piercing Pattern
The market is in a downtrend. The bearish black real body reinforces this view. The next session the market opens via a gap, but the market surges forward closing way above the previous day’s close. Those who are looking to buy would say no new lows could not hold and could view it as an opportunity to buy.
More factors to consider (in increasing importance)
- On the second day, very high volume could lead to a selling blowoff (many sellers close their position on the lower opening by selling but the market quickly buys up the stock)
- If the second body of the piercing pattern opens below a major support level and then goes past the support, it shows that the bears were unable to take control of the market
- The pattern’s white candlestick should push more than halfway into the black candlestick’s real body. This is so that it is not confused with other similar patterns (namely On-Neck, In-Neck and Thrusting Pattern) which gives a different reversal signal.
- The lowest point of the two sessions that formed the piercing pattern can be the support (Additional Point, not in any order of importance)
- Good to wait for confirmation with a high close the session after the white candle if the piercing pattern doesn’t push deeply into the prior black candle
All image credits goes towards the book “Japanese Candlestick Charting Techniques” by Steve Nison. Nison, S. (1991). Japanese candlesticks charting techniques: A contemporary guide to the ancient investment techniques of the Far East. New York Institute of finance.