 by
by 1. Windows
A window is also known as a gap in Western technical analysis (the expression used is ‘filling the gap’). The main characteristic of windows is a ‘gap’ between the highs and the lows of two consecutive sessions. On intraday charts, windows are mostly formed between the last candle line of the prior day and the first line of the current day.
There are two types of windows, a) rising window and b) falling window.
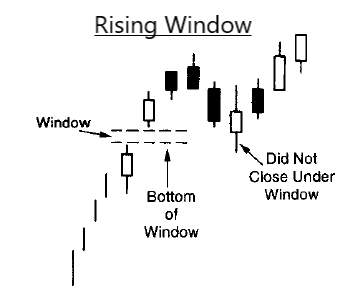
Rising Window
The rising window is a bullish signal. There should be a price gap between the prior sessions’ high and the current session’s low.
A rising window should also be a zone of support on pullbacks, where the key support area for a rising window is the bottom of the window (applies to relatively large windows). However, if the pullback closes under the bottom of the window, the prior uptrend will be voided.
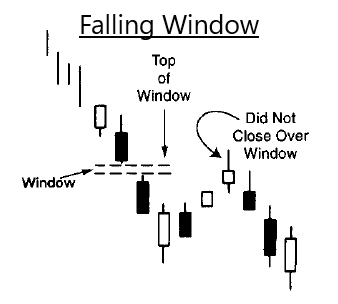
Falling Window
On the other hand, the falling window is a bearish signal. There should be a price gap between the prior sessions’ low and the current session’s high.
A falling window should also be a zone of resistance on rebounds, where the key support area for a falling window is the top of the window (applies to relatively large windows). However, if the rebound closes above the top of the window, the prior downtrend will be voided.
Summary
Typical Japanese technical analysis states that after three up or down windows, the chances are that the market is too overbought/oversold to continue the trend. However, a more clear indicator would be that the trend is still up until voided when the market closes under the bottom of the top window (rising window).
Below is the summary of the differences between rising and falling windows.
| Rising Window | Falling Window | |
|---|---|---|
| Bullish/Bearish Signal | Bullish | Bearish |
| Support/Resistance | Support | Resistance |
| When to buy/sell | Buy on dips (buy inside the window) | Sell on rebounds (sell inside the window) |
2. Tasuki
A specific combination of two candles that gap higher or lower (window then the two candles). The two candles of the tasuki should be about the same size. Both types of tasuki are rare. Previously mentioned window support/resistance concepts apply.
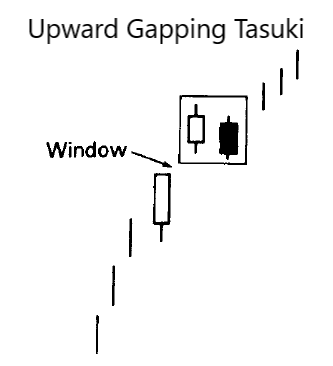
Upward Gapping Tasuki
The upward gapping tasuki is made up of a rising window followed by a white candle and followed by a black candle. The black candle opens within the white candle’s real body and closes under the white candle’s real body. However, if the market closes under the bottom of the window, the bullish outlook would be voided.
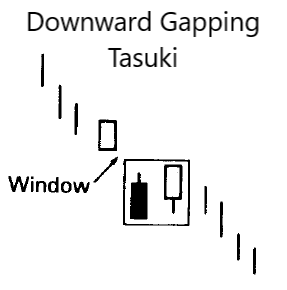
Downward Gapping Tasuki
The downward gapping tasuki is made up of a falling window followed by a black candle and followed by a white candle.The white candle opens within the black candle’s real body and closes above the black candle’s real body. However, if the market closes over the top of the following window, the bearish outlook will be voided
3. Gapping Plays
Gapping plays are a group of small real bodies after a sharp advance/decline in the market to consolidate followed by an upward/downward window.
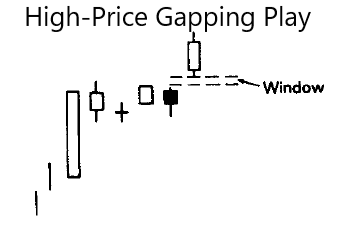
High-Price Gapping Play
A group of small real bodies after a strong white session followed by a rising window. This is a bullish signal.
However, the pattern is voided if the market closes under the rising window that completes the gapping play.
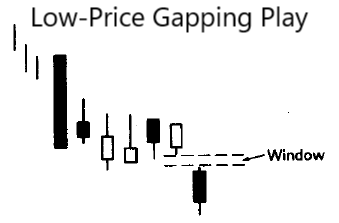
Low-Price Gapping Play
A group of small real bodies after a strong black session followed by a falling window. This is a bearish signal.
However, the pattern is voided if the market closes above the rising window that completes the gapping play.
4. Gapping Side-by-Side White Lines
A gapping white candle followed by another similar-sized white candle with about the same opening in the next session. It is not a critical pattern to remember, with the importance being the rising and falling windows.

Upgap Side-by-Side White Lines (in an uptrend)
An upgap side-by-side white lines occur in a rally where an upward-gapping white candle is followed by another similar-sized white candle with about the same opening. It is a bullish continuation pattern.
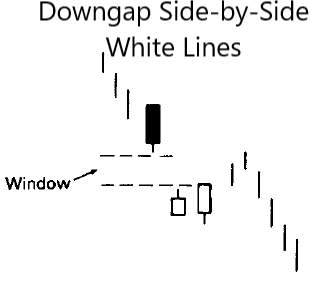
Downgap Side-by-Side White Lines (in a downtrend)
The rarer pattern of the two, the downgap side-by-side white lines. It occurs in a downtrend where a downward-gapping white candle is followed by another similar-sized white candle with about the same opening. It is a bearish continuation pattern, with the white lines viewed as the shorts covering.
Conclusion
In the next part of continuation patterns, I will cover the rising/falling three methods as well as separating lines. If you would like to learn more of such Japanese Candlestick Patterns, I highly recommend the book ‘Japanese candlestick charting techniques’ by Steve Nison. The content covered in this article is covered in depth in Chapter 7 of his book.
*Full credits of the chart images to his book.
Cheers!
-Rice