
 by
by Hey everyone! In today’s post, I will be taking a page out of Warren Buffet’s book on how to determine what companies to invest in. The book is called ‘Warren Buffett Stock Picks: Why And When He Is Investing In Them’. After reading this article, do take some time to read the book as well : ) Now, let’s begin!
What is Buffett’s Strategy?
Before we dive into the metrics that Buffett uses and what analysis he does, I think it will be a good idea to cover some broad overarching principles of his general strategy. First, he identifies companies with a durable competitive advantage. What does that mean? It means that the company has a ‘great long-term economics working in its favour’.
Next, what he will do is let the cash pile up as companies trade at extremely ‘expensive’ prices. In a bear market or panic, that is when Buffett uses his superior knowledge of the business to buy into companies that have superior long-term economics working in their favour —- and then hold them for the long term.
Such a strategy is counterintuitive to what the rest of the market is doing —- when others are selling, he is buying. When others are celebrating their bull market riches, he is socking cash away and accumulating his financial ‘firepower’ for when the next bear market hits.
Part 1
In this first part, we will be looking at two important metrics, the earnings per share (EPS) and the per share book value (book value) to determine ‘good’ stocks to invest in. Let’s begin!
Earning’s History
Firstly, Warren Buffett looks for businesses with an earning’s history that is consistent and has a strong upward trend over a ten-year period. This can be observed by looking at the company’s historical EPS year-on-year growth. A company with an erratic earnings history is unlikely to be the company we are looking for as they lack a durable competitive advantage and have no brand identification.
Per share book value (book value)
The per share book value (or book value) is the company’s equity value (assets – liabilities) / number of shares outstanding. A company with a durable competitive advantage should have a book value that is growing over time. I will not go into depth about using book value to calculate growth rates as typically a stock trades much higher than its book value. Hence it may not be the best data to calculate growth rates.
Part 2
In this second part, I will go through how to use the metrics discussed in Part 1 to make our calculations to calculate an investment’s future return and Buffett’s equity-as-a-bond theory.
Equity Bond
What is an Equity Bond? According to Buffett, it is a company with a durable competitive advantage that has such predictable earnings that the stock is really more like a bond. According to the book, he believes that the ‘rate of return’ on the equity bond is equal to what the company’s net profits are in any given year. For example, a company with a per share book value of $100 a share and annual after-corporate tax earnings of $8 per share can be argued to have an annual after-corporate tax return of 8%.
Based on the company’s historical earnings growth rate, it can be argued that with time, the underlying return on the equity bond will increase. This would be known as an ‘expanding equity bond’ as over time, the rate of return on the initial investment will ‘expand’ as the earnings keep growing.
To make the calculations for an equity bond you will need:
- Per share book value
- Market Price of the share
- EPS
- Historical net earnings growth rate.
To find the rate of return (ROR) EPS / Market price of the share (or book value). We shall cover this in-depth in the next section.
Projecting an investment’s future return
Before we dive into the analysis, I will go through one more strategy that Buffett does to determine if a company with a durable competitive advantage is worth investing in. This will be done by calculating the company’s future value.
Historical EPS compounded annual growth rate
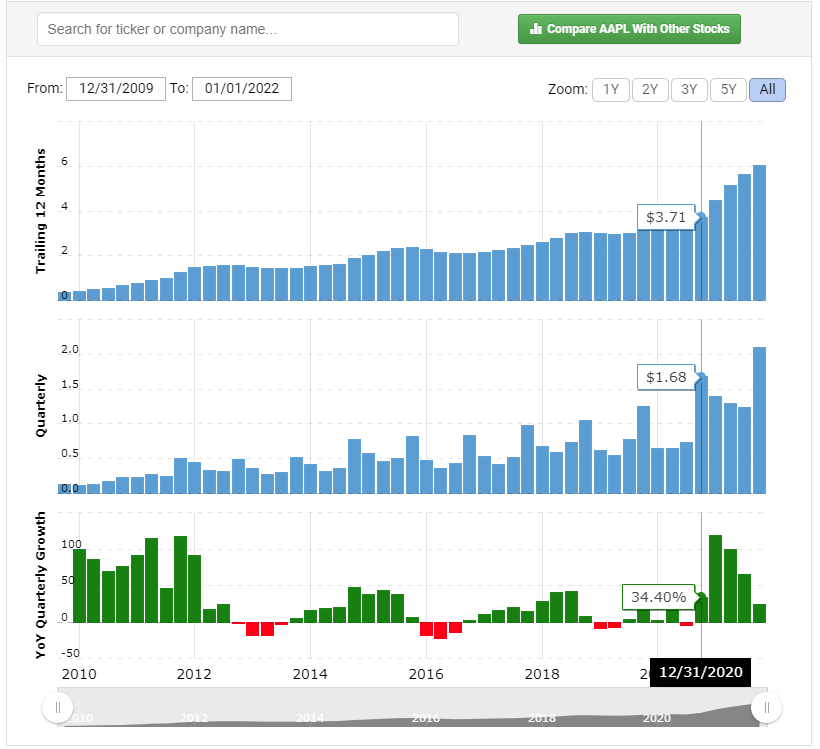
Firstly, we would get the historical EPS data of the company. I usually get this data from Macro Trends. Simply type in the ticker symbol to get the diluted EPS results. We should observe that the historical EPS is showing a consistent upward trend
To get yearly EPS data, simply refer to the trailing 12 months (TTM) graph. Hover over the last earning results of the year (typically in the month of December) to get the cumulative EPS for that year. For example, Apple’s EPS for the year 2020 is $3.71.
Alternatively, we can use Morningstar’s Key Ratios data. To find the EPS data of a specific stock, we will enter the stock’s ticker into the search bar as shown below.

As seen below, typing the link above allows me to access Apple’s (Ticker: AAPL) financial data including the yearly EPS. Unlike the Macro Trends website, the EPS data is fixed based on the annual earnings report. Hence for Apple’s EPS in 2020, it is 3.28 as their Fiscal Year typically ends in September.

Afterwards, we will use the rate of return calculator to calculate the historical EPS compounded annual growth rate. To calculate the annual growth rate, we shall input the following details:
- Present Value: Base Year EPS
- Future Value: Final Year EPS
- Number of Years: Final Year – Base Year.

For example, if you are looking at a time period of 2011 and 2021, 2011 is the base year (or year zero) and 2021 is the final year (year 10).
Future market value
Next, we can calculate the stock’s future EPS. To calculate this, we require the following data and use the Future Value Calculator.
- Historical EPS compounded annual growth rate (calculated previously)
- Current Year EPS
- Number of years
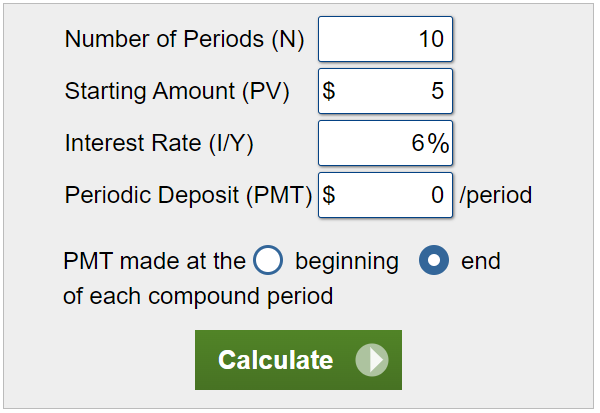
For the Number of Periods (N), we will input the number of years out into the future we want to calculate. Next, for the Starting Amount (PV), we will input the current year’s EPS. For the Interest Rate (I/Y), we will input the historical EPS compounded annual growth rate. Lastly, we will leave the Period Deposit (PMT) blank. Hit calculate and you will get the future EPS value.
Finally, we can calculate the market price of the stock in the future. First, we will need to find the lowest of the stock’s historical PE (preferably in the past 10 years or more). We will take the future EPS x lowest PE to get the projected future market value. To calculate the projected ROR, we will use the same Future Value Calculator.
- Input the current market price (or purchase price) as the Present Value
- Input the projected (future) market price as the Future Value
- Input the number of years as the same number of years we used to calculate the future market price.
Dividend Component
In addition to the future market value, we can take into account dividends if it is a dividend-paying stock. Assuming a historically stable or rising dividend we can take the current dividend payout per share (yearly) x the number of years into the future to get the total dividends earned over that period (assuming the stock can maintain its dividends). We can add it to the future market value to get the valuation inclusive of dividends.
Part 3
In this third and final part, I will be using the concepts in both Part 1 and 2 to do an analysis of prospective companies that we will invest in. Then, I will be using this analysis on a real-life example!
Analysis
Now, using the concepts mentioned in the book previously, we will combine them to do an analysis of the companies. This is broken down into a few main steps.
- Firstly, we will find the historical EPS compounded annual growth rate. This will be taken from our EPS data (typically a 10 year horizon).
| Data Needed | Formula |
|---|---|
| EPS data (need minimally the base year, year 0 and last year) | Using the rate of return calculator we will enter the following: 1. Present Value: Base Year EPS 2. Future Value: Final Year EPS 3. Years: Final Year – Base Year |
- Secondly, we will find the rate of return (ROR) on the ‘equity bond’. This can be found in the EPS/market price. We will be using the market price for our calculations as that is the price that we bought the shares for, which will help us estimate our future return.
| Data Needed | Formula |
|---|---|
| Earnings-per-share (EPS), market (purchase) price | After-corporate tax initial ROR (%) = EPS / market price |
- Thirdly, we will calculate the projected EPS using the Future Value calculator.
| Data Needed | Formula |
|---|---|
| Current EPS, compounding per share growth rate (in point 1) | We will input the following data into the calculator: 1. Number of periods (N): 10 (or how many years) 2. Starting amount (PV): Current EPS 3. Interest Rate (Y): Compounding per share growth rate (in point 1) 4. Periodic Deposit: 0 5. PMT made at the end of each compound period |
- Lastly, we can calculate the projected future stock price.
| Data Needed | Formula |
|---|---|
| Projected EPS (point 3), lowest historical PE ratio, Current dividend amount [For historical PE ratio, we will use the lowest PE ratio in the past period. We use the current dividend amount as we assume the company will at least maintain the dividend payout] | Taking the Projected EPS x Lowest historical PE ratio, to find the projected future stock price. To calculate the full future ‘value’ we can add in the dividends. Current dividend amount x Time period (n) + projected future stock price = Total future value. |
Example
Now let us put what we have learned into practice. For this example, I will be using everyone’s favourite fruit company, Apple!
- Firstly, let us identify the base year EPS and final year EPS. We will be using the Morningstar page for the data
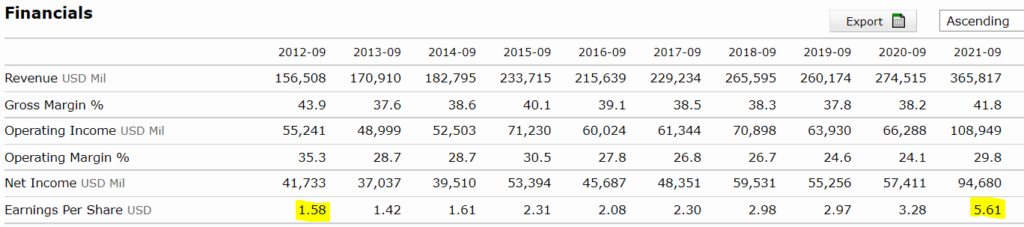
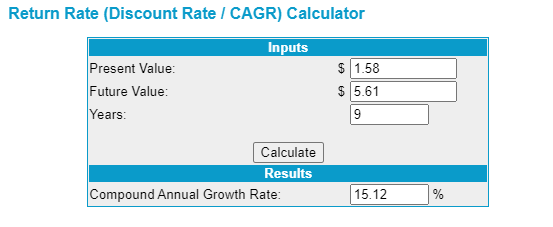
The base year (2012) has an EPS of 1.58 at the end of the fiscal year and a final year (2021) EPS of 5.61. The number of years is 2021 – 2012 = 9.
- Putting the above values into the rate of return calculator, we find that Apple’s historical EPS compounded growth rate is 15.12%.
- At the end of the 2021 fiscal year, Apple was trading at roughly $141.50 a share. Hence, we can argue that we will be earning a 5.61 / 141.5 = 3.96% after-corporate tax initial rate of return.
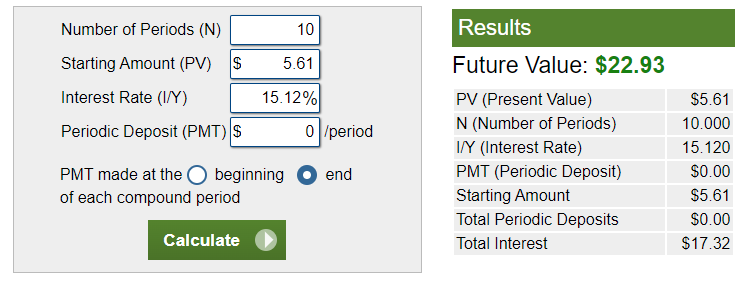
- Afterwards, we shall calculate the future projected EPS. Using the Future Value calculator, we will input the following details
- Number of Periods: 10
- Starting amount (PV): 5.61
- Interest Rate (Y): 15.12%
- Periodic Deposit: 0
Hit calculate and we will get a projected EPS of 22.93 in 2031.
- Lastly, we will calculate Apple’s projected stock price. We first have to identify Apple’s lowest historical PE which we can get from Macro Trends. From there Apple’s lowest PE ratio was back in June of 2013 at around 8.65. Taking the projected EPS x historical low PE we will get a future share price of $198.34 (22.93 x 8.65). This will give us an annual rate of return of 3.43%.
- For the 2021 fiscal year, Apple’s total dividend payout was $0.85. Assuming that Apple minimally maintains their dividend payouts, we can get a total value including dividends of $206.84.
Conclusion
And there we have it! Hopefully, you find this useful. This Buffett method is a simple and relatively effective way to gauge future returns over a long time period. That said, such an analysis is merely an indicator of future returns and does not guarantee the future stock price. After this article do take a read of the book as well for more examples. Cheers!
-Rice


yet another informative post! good job rice!
Thank you! Appreciate your support : )